
Qiji 2026 Roadshow Panorama
56 roadshow projects, from on-site photos to a publishable DD panorama page, all through one pipeline
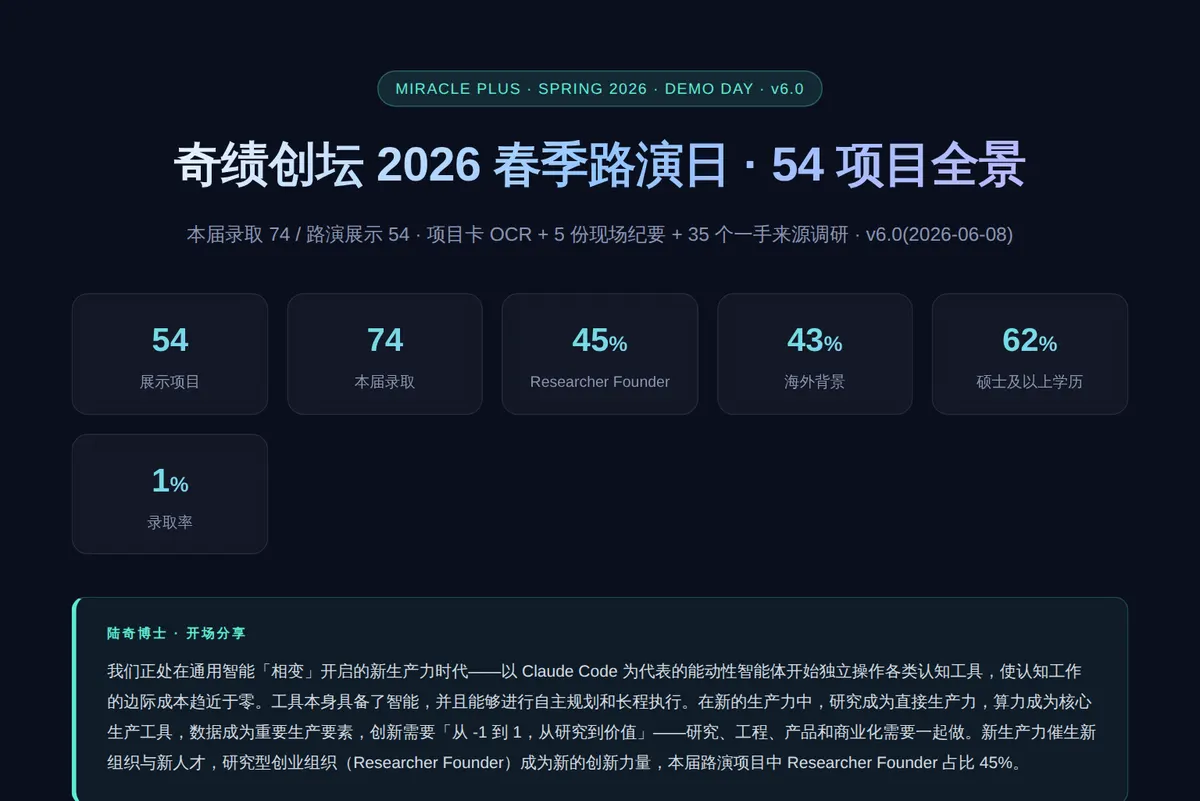
What it is
It takes the on-site material from a roadshow / demo day / accelerator graduation showcase (project-card photos + exhibition-wall photos + the organizer’s public articles) and turns it in one pass into 6 distributable assets:
- A structured JSON dataset—standardized fields for every project
- A panoramic interactive HTML landing page—zoomable browsing by section / track
- A sortable, filterable DD table page—7 parallel research agents each run team / market / technology / financials / competitors / risk / peer benchmarking
- A deep Word report—the version for the fund’s IC
- A CSV table—opens directly in Excel / Numbers for further analysis
- One-click deploy to Cloudflare Pages—
qiji-roadshow-2026.pages.devis exactly what this pipeline spat out
Why build it
A roadshow floor has an extreme information density, but it’s scattered across 200 phone photos, 3 public-article links, and your memory. A week later it’s basically “watched and forgotten.”
Having a Claude Skill finish the photo OCR + article parsing + horizontal DD in parallel, structuring it into a database once so that afterward it’s indexable, comparable, and publishable, can be at least an order of magnitude better than “watched and forgotten”—especially for people who want to write an external deliverable afterward (a fund brief / newsletter / industry note).
How you can use it
Drop material of the same type (demo day / YC roadshow / VC demo day / accelerator graduation showcase) into:
/demo-day-dossier <event name>Attach a folder (cards + wall photos) and the official article URL, run the six-piece set in half an hour, and push it live as the final step.
Best for: investment firms doing demo-day reviews, researchers doing track mapping, media writing industry notes, and accelerators building an external showcase.