
excel-ai-analyst
Upload a spreadsheet, see through its structure first
What it is
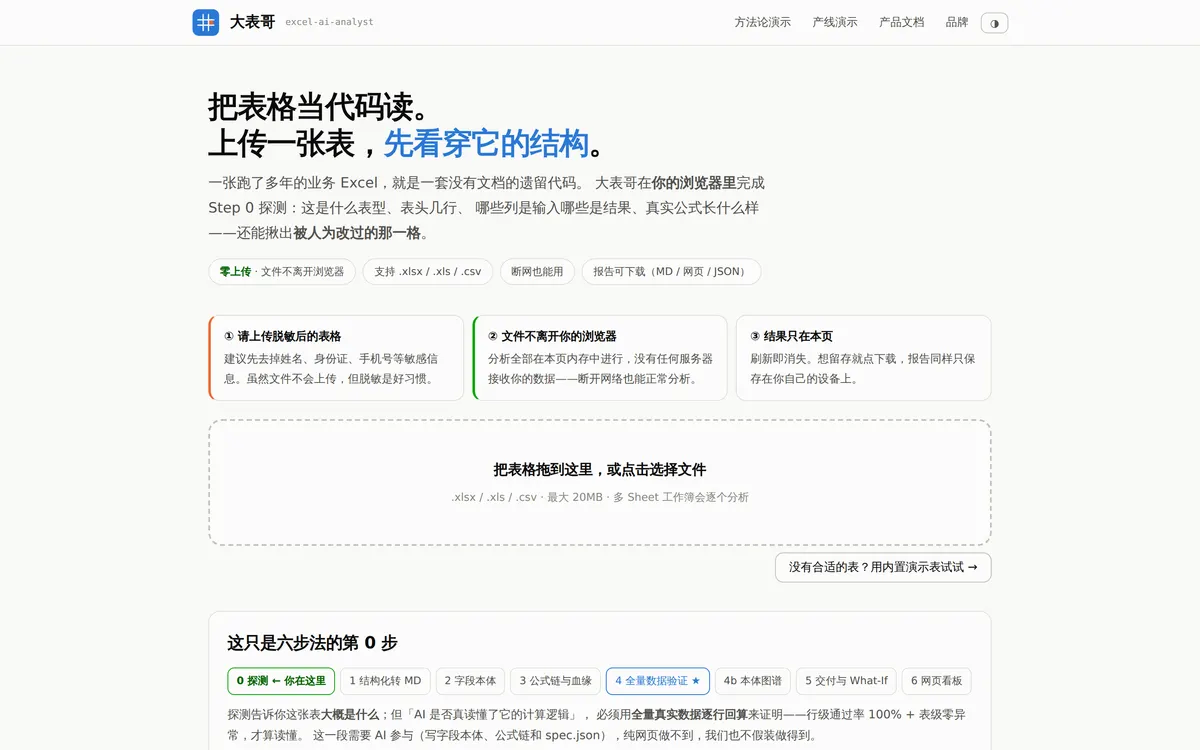
Read spreadsheets as code. A business Excel file that has been running for years is really a legacy codebase with no documentation — this tool does step 0 of the reverse engineering inside your browser:
- what shape the sheet is, and how many header rows it has
- which columns are inputs and which are results
- what the real formulas look like
- which cell has been edited by hand (should be a formula, is now a hard-coded value)
Supports .xlsx / .xls / .csv, up to 20MB, analysing multi-sheet workbooks one sheet at a time. Reports download as Markdown, HTML or JSON.
Zero upload: everything runs in this page’s memory — no server ever receives your data, and it works with the network disconnected. Results vanish on refresh; download if you want to keep them, and the report stays on your own device too.
Why build it
The first obstacle to “putting a manual Excel process on AI rails” isn’t compute, it’s trust: you are not going to upload your company’s real cost or payroll sheet to some website. So step 0 is deliberately pure front-end — the engine is a function-by-function port of excel_ai.py, the file-format layer is same-origin SheetJS, and the page makes no external requests at all.
The second obstacle is proving the AI actually understood it. Detection only tells you roughly what the sheet is; confirming the reading is correct requires recomputing every row against the full real dataset — 100% row-level pass rate and zero sheet-level anomalies, or it doesn’t count. That’s step 4 of the six-step method, it needs AI in the loop, a plain web page can’t do it, and the site doesn’t pretend otherwise.
How to use it
Open anp.asia and drag a sheet in; there’s a built-in demo sheet if you don’t have a suitable one. Redact first (names, ID numbers, phone numbers) — the file never leaves your browser, but it’s a good habit.
The full six-step method: 0 detect (this page) → 1 structure to Markdown → 2 field ontology → 3 formula chains and lineage → 4 full-data validation → 4b ontology graph → 5 delivery and what-if → 6 web dashboard. The site has a pipeline demo with real output plus the product docs.
Known limits: date columns are treated as numbers; formula extraction from .xls is best-effort — save as .xlsx first for better results.